Accelerate Your Insights
Unlock decision intelligence with a composable stack of machine learning models, adaptive dashboards (Power BI / Tableau) and domain‑grounded AI — from lean baselines to deep learning & LLM augmentation aligned with your KPIs.
Model Range
Stat → DL → LLM augmentation
Activation
Power BI • Tableau semantic
MLOps
Version • monitor • drift
KPI Focus
Bias • churn • stockouts • uptime
From Raw Data to Decision Intelligence
Dashboards alone don't generate competitive advantage. We blend descriptive analytics, predictive models and prescriptive AI to surface signals, opportunities and risks earlier.
Engagements start lean: a baseline model (seasonal regression / LightGBM) plus a focused Power BI / Tableau semantic layer. As volume & complexity grow we introduce deep learning architectures, embeddings or domain‑grounded LLMs only when marginal value is proven.
Every model is tied to a measurable KPI: forecast bias, inventory turns, churn, conversion uplift, downtime, SLA latency. We right‑size complexity, validate rigorously, monitor drift and close the loop into operational workflows.
Model Range
Stat → DL → LLM
Activation
BI • APIs • reverse ETL
Scalability
Right-cost • perf tuned
Governance
Version • lineage • audit
Why Teams Choose Our AI Model Approach
Impact-first, extensible and governed — not AI theatre.
Adaptive Complexity
Baseline → DL → LLM only when value-positive
Production Discipline
MLOps, monitoring & drift detection early
KPI Alignment
Bias • churn • conversion • stockouts • uptime
Analytics Activation
Semantic layers & dashboards integrate outputs
Business KPI Impact
Typical uplift ranges when moving from descriptive reporting to governed ML & activated decision flows.
Indicative ranges based on industry benchmarks & prior engagements. Actual impact depends on data quality, adoption and baseline maturity.
Power BI & Tableau as First-Class Activation Layers
We design semantic models & metrics contracts early so every engineered feature can also power a trustworthy human decision interface.
- •Semantic Consistency: One definition of margin, churn, on‑time fill — synchronized across models & dashboards.
- •Explainability Built-in: Feature importance & forecast bands surfaced via visuals/extensions.
- •Closed Loop: User overrides in BI tools feed retraining sets & prompt refinement.
- •Governance: Row & column security aligned with model serving auth.
📈 Unified Metrics Fabric
Dashboards & models share lineage: every chart traceable to feature views; incidents triaged faster with unified observability.
Reverse ETL + embedded analytics push insights into CRM / ERP flows — making actions immediate & measurable.
Custom AI Use Cases
Case studies showing model choice, business impact & quantified outcomes — inspired by real industry challenges (e.g. Pernod Ricard).
Demand Forecasting
SKU-level replenishment – Pernod Ricard
Challenge: Large SKU portfolio across markets with seasonality & promo peaks. Poor forecasts create stockouts during promotions & excess inventory off-season.
🔬Model & Approach
Blend of gradient-boosted trees (LightGBM) for short/medium horizons + hierarchical Bayesian model to borrow strength across SKUs & locales; external regressors: weather, promo flags, price elasticity, holidays.
⚙️Implementation
- •Databricks pipeline ingesting POS, ERP & promo calendars
- •Feature store for time-window features & promotion embeddings
- •MLflow tracking; CI retraining on rolling windows
- •Batch scoring for daily replenishment recommendations
📈Measured Impact
Multi-million EUR savings via lower markdowns, reduced working capital & improved service rates.
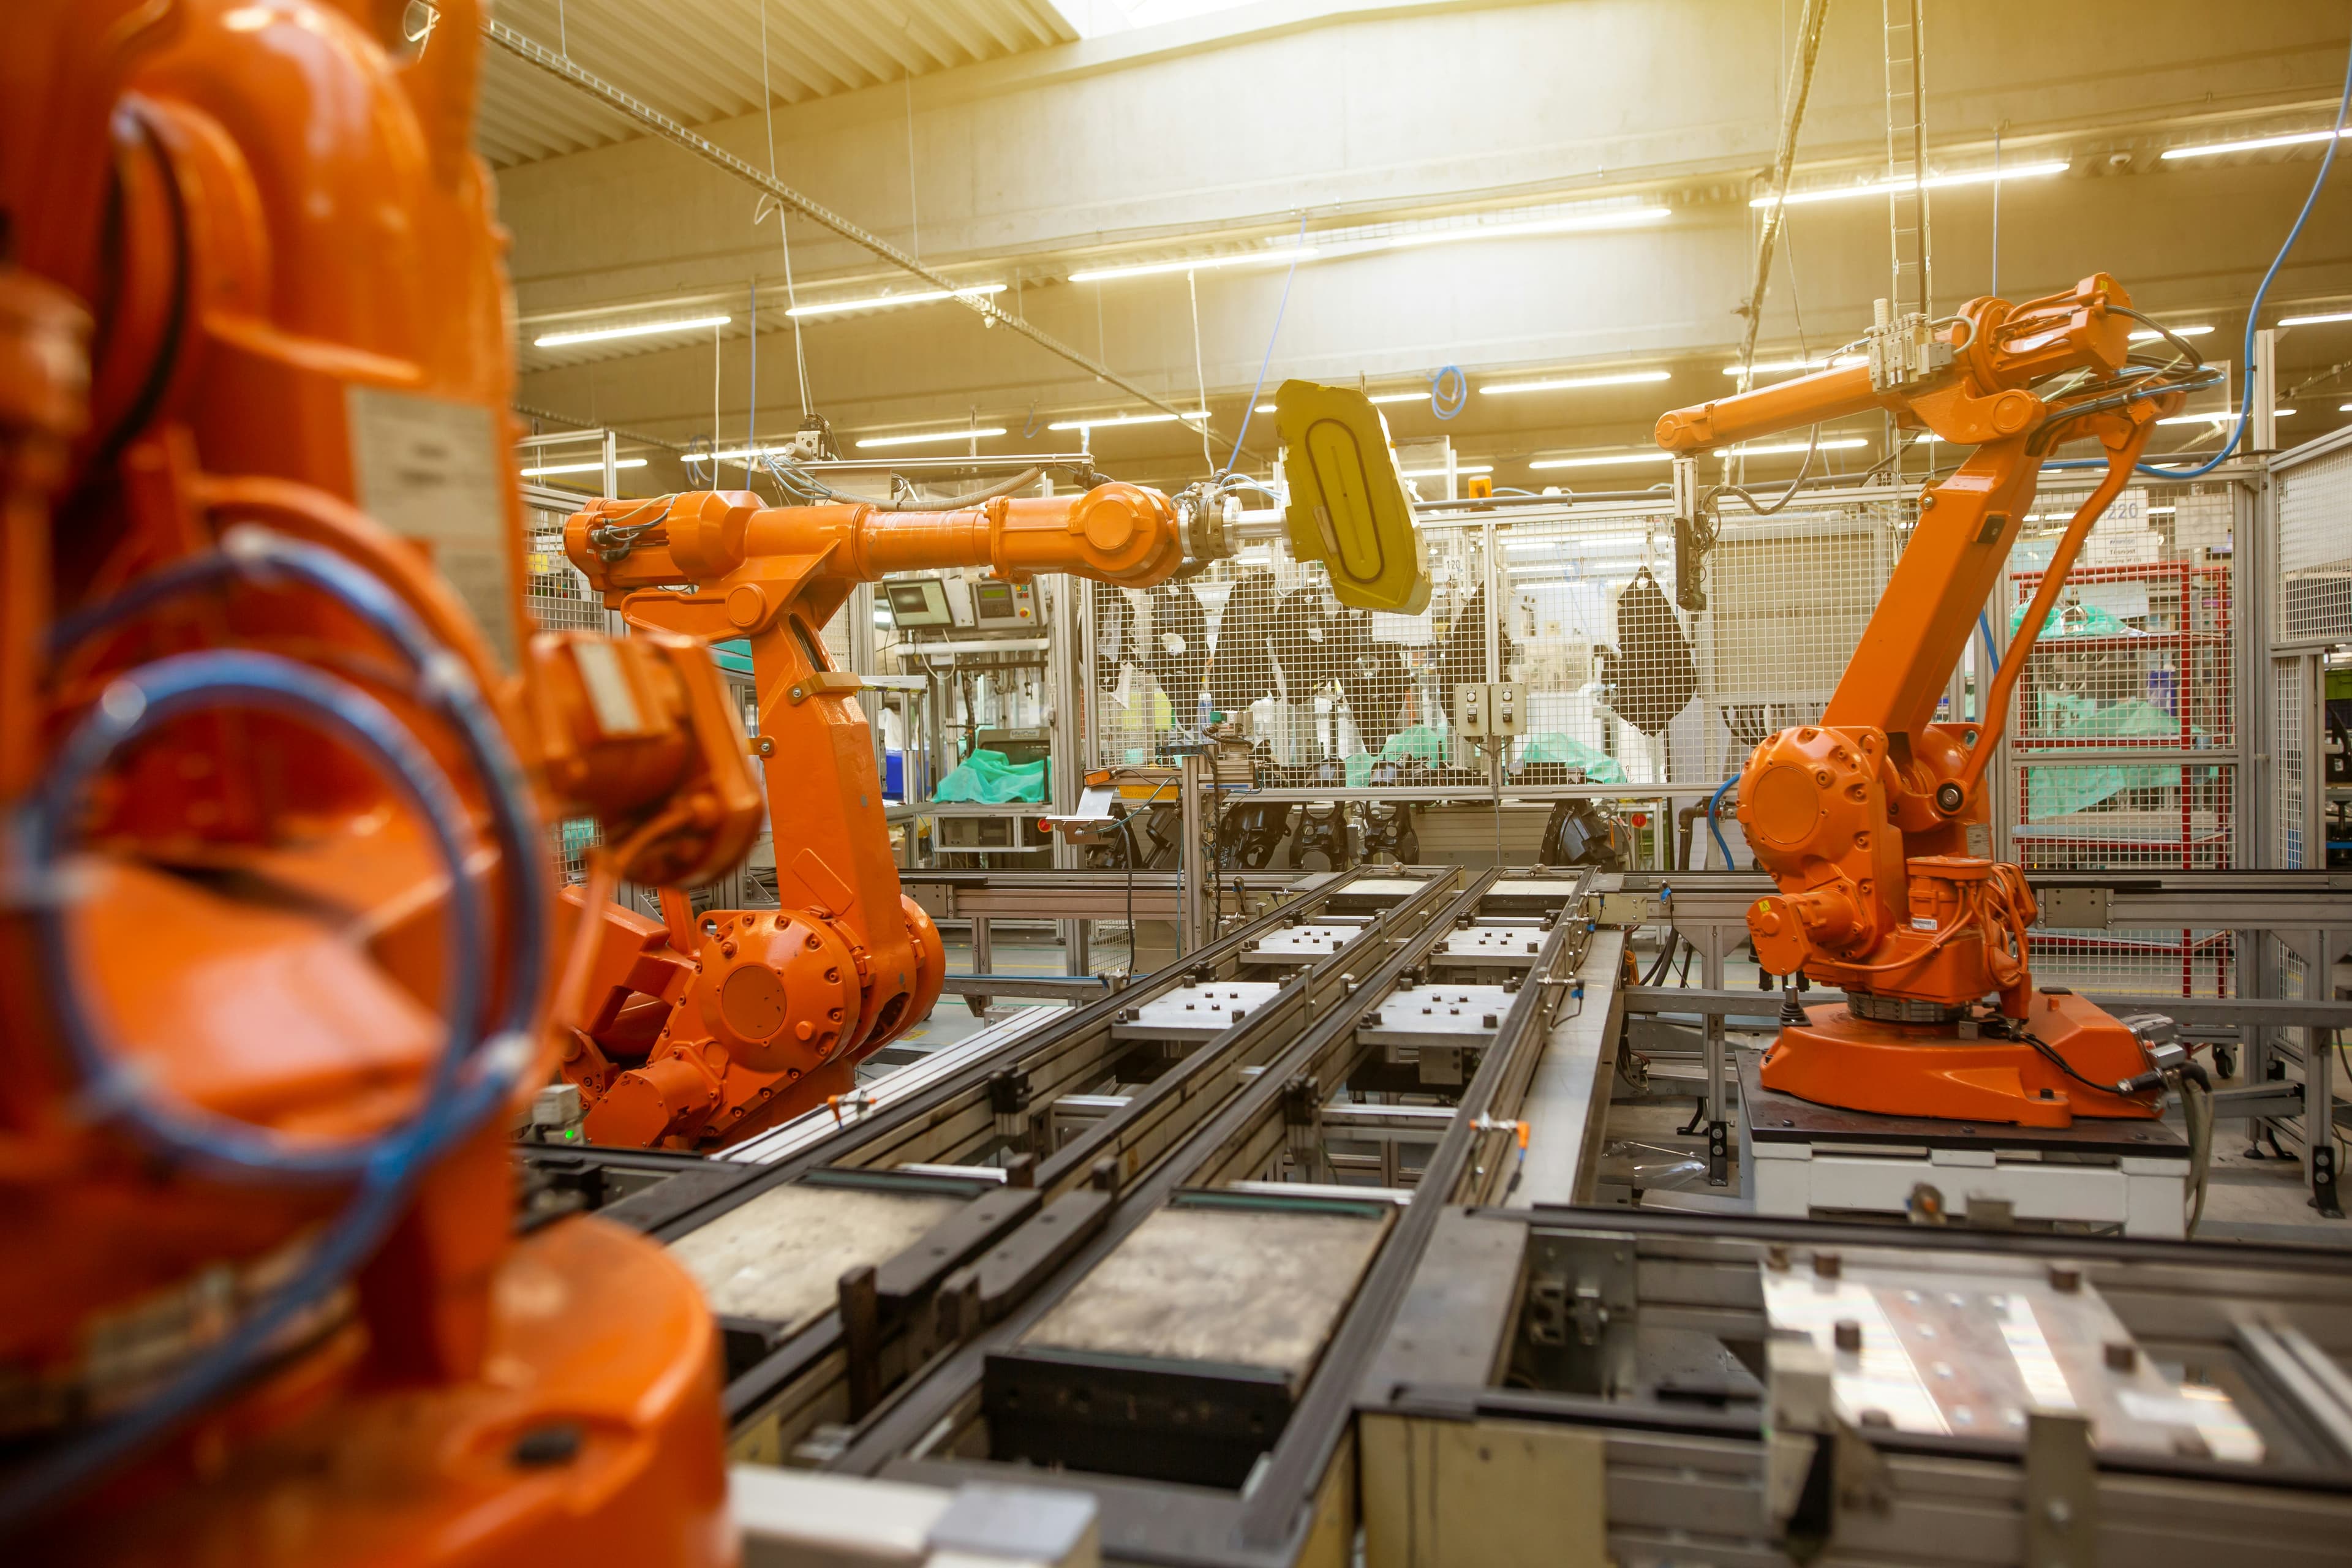
Predictive Maintenance
Bottling line uptime optimization
Challenge: Unexpected failures cause lost production windows & expedited repairs. Early degradation detection prevents cascading issues.
Model & Approach
Sequence models (Temporal CNNs) for trend extraction + anomaly detection (autoencoders / isolation forest) on multivariate sensor streams; supervised layer for RUL where labeled failures exist.
Implementation
- Edge telemetry ingestion into time-series lake
- Feature extraction (sliding windows, FFT vibration spectra)
- Drift detection triggers retraining cadence
- Alerts with recommended actions & parts list
KPIs & Impact
Unplanned downtime reduction: 15–30%
Maintenance cost savings: 10–20%
Higher OEE → improved on-time fulfilment & lower per-unit cost.
Next Best Actions
Trade marketing & CRM personalization
Challenge: Targeting the right action at the right time lifts conversion & reduces wasted spend.
🔬Model & Approach
Hybrid recommenders: matrix factorization + product embeddings + uplift model estimating incremental impact; business rules enforce constraints.
⚙️Implementation
- •Unified POS, CRM & campaign response store
- •Offline A/B tests with holdout groups
- •Real-time scoring powering CRM suggestions
📈Measured Impact
Lower wasted spend via better targeting & higher per-store conversion.

Ready to Accelerate Your Insights?
Let's build AI models that transform your data into competitive advantage.